Resolve: Examples of Inputs and Outputs

  • Resolve presentation
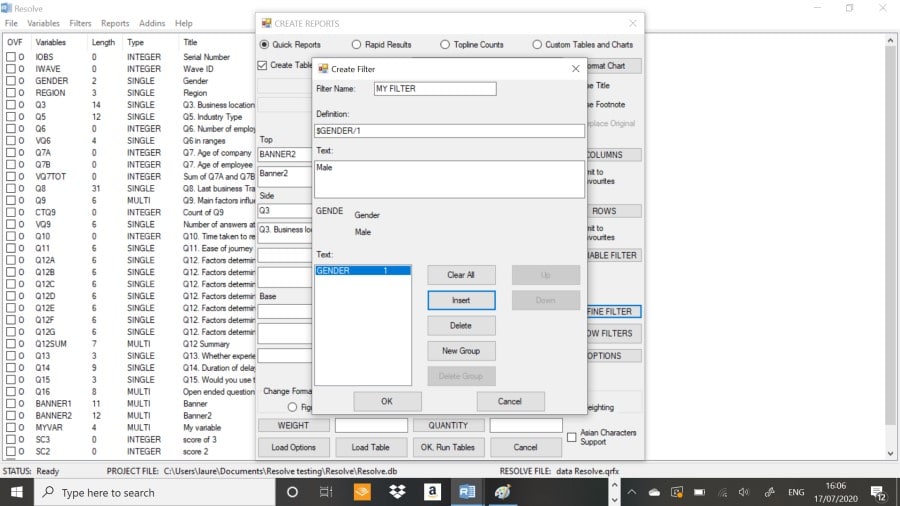
  • Analysis specifications

    Drill down into your data to discover more insights

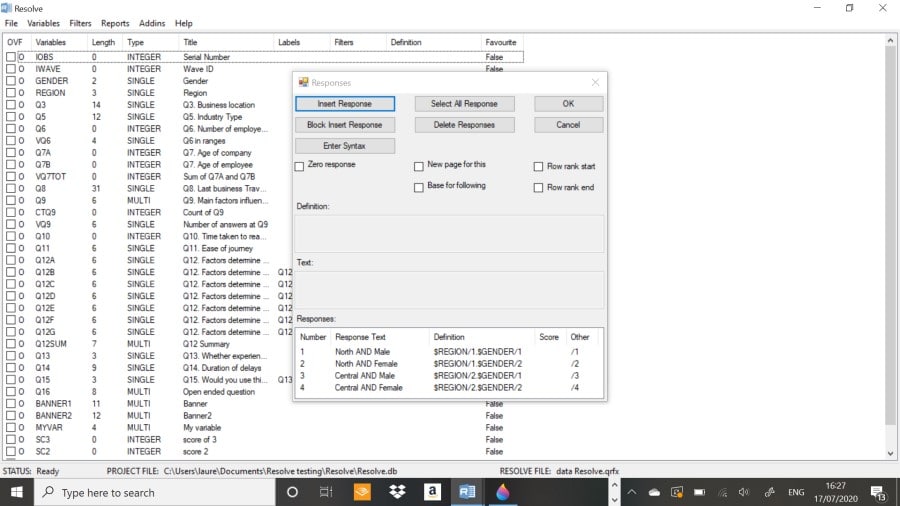
    Building your own variables in Resolve
  • Analysis specifications

    Select the questions and variables that you want to analyse

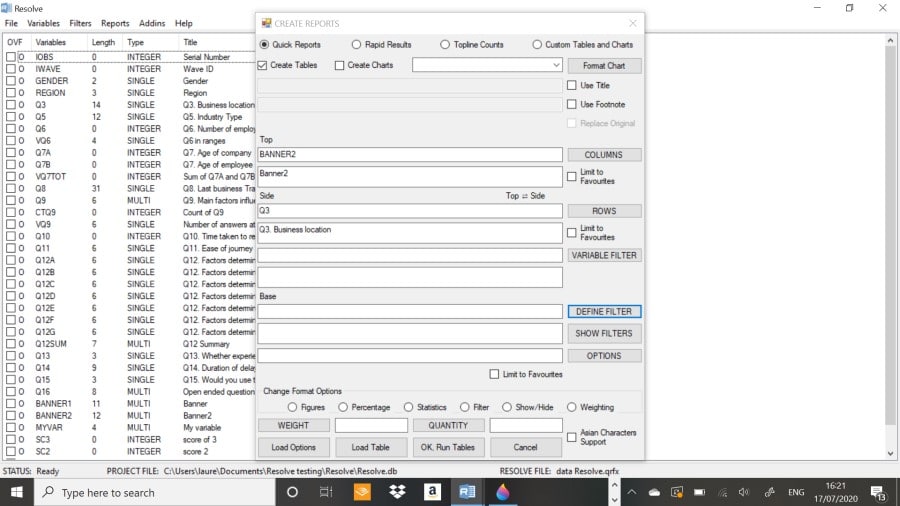
    Specifying tables in Resolve
  • Produce tables

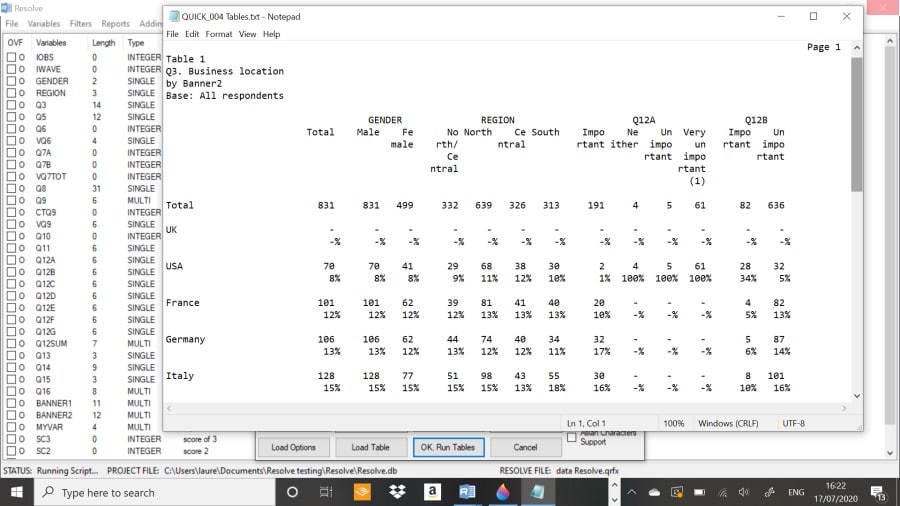
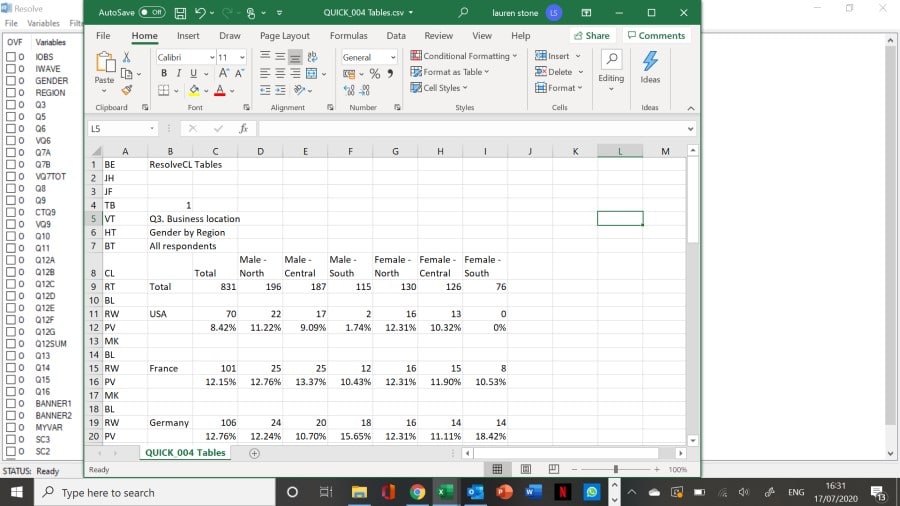
    Output your results as tables as text, Excel spreadsheets or as a chart

    Producing tables in Resolve
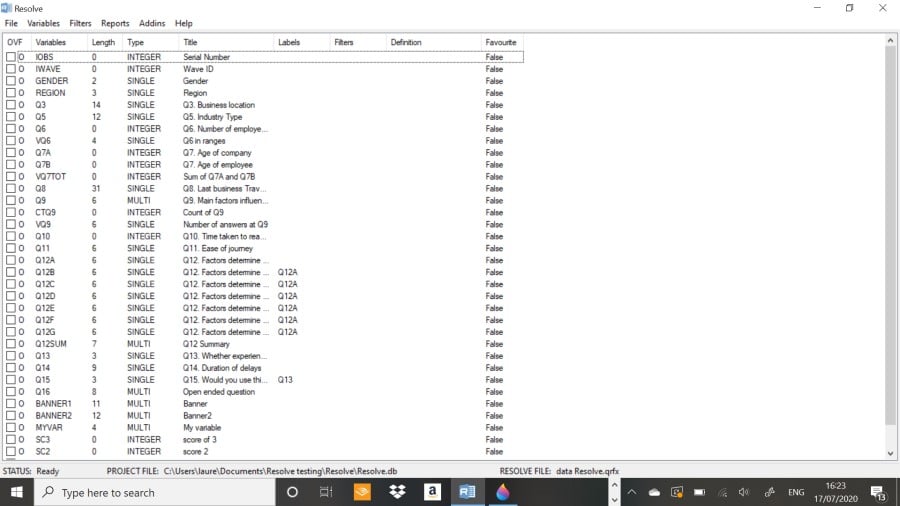
  • Organise your variables

    Choose favourites, put questions and variables into groups and build new variables for analysis

    Organising variables in Resolve for secondary analysis
  • Premium version add-ins

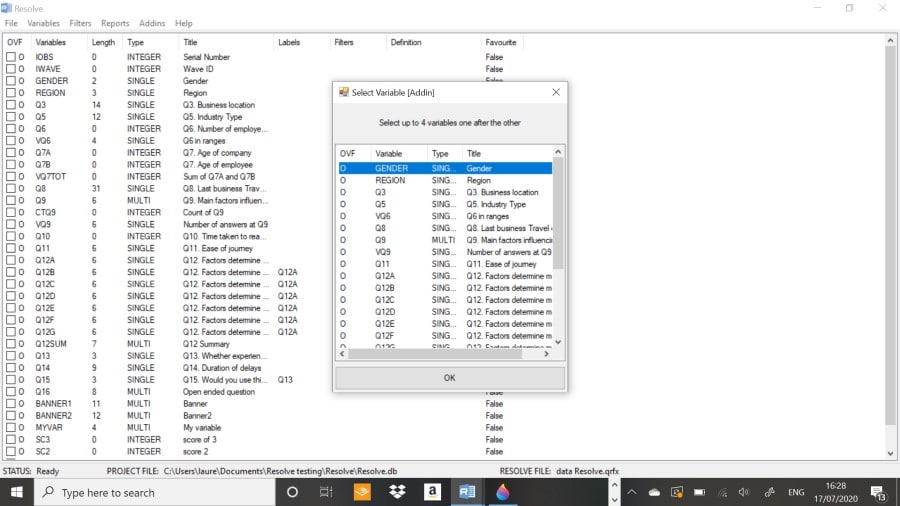
    Make use over 20 free add-ins that produce complex analyses or simplify repetitive needs

    Making use of the power of add-ins in Resolve
  • Premium version add-ins

    Build your own add-ins so that you and your clients to use your own analyses or algorithms

    Using variables in Resolve
  • Capture insights

    Bring your data to life and get the most from your surveys

    Generating tables in Resolve
  • Charting and reports

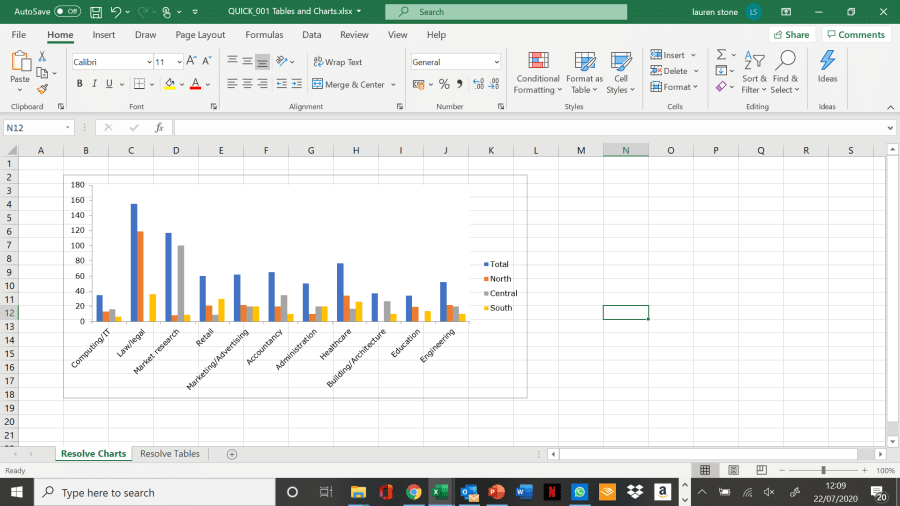
    You can produce for free in the Base version and automate whole PowerPoint/Excel reports in the Premium version

    A basic chart produced in Resolve

Resolve is an easy-to-use software package that allows colleagues and clients share projects for secondary analysis. You can drill down into data and produce tables and charts.

Resolve Base is free to use. Resolve Premium allows you to use powerful add-ins and automate PowerPoint/Excel reports.